Website Performance Analysis through “WebPageTest”
Performance test is done to ascertain the behavior of the components of a system/software under a given situation/environment. A successful performance testing should project all the issues related to database, network, hardware, software, etc. Such a process is also done for the cause of validating outstanding system attributes like versatility, resource usage as well as dependability. Performance testing is entirely different when compared to the concept of functional testing, if the former one is done for predicting whether an application will execute what it is literally intended to, in reality, the latter one tells you whether the application can execute what it is indented to without many errors.
Given below are the names of few popularly used open source performance testing tools:
- Apache JMeter
- OpenSTA
- WebLOAD
- Neustar (for website monitoring) &
- WebPageTest
WebPageTest Among the above listed open source performance tools, web page test is one of renowned tools assisted by Google. This tool literally provides you with insights on how to make your website faster by analyzing various factors and by giving accurate results. Web page test caters advanced testing privileges via multi-step transaction, video capture etc. Let us get started with how to perform a website test with web page test. To Get Started With Your Test … Details of Testing: Webpage or website URL to be tested Test location Browser name and version to perform this test. Sample Test Result I have performed performance analysis test on our domain and the stats are given below: First View: with no cache Repeat View: with cache The repeat view happens as soon as the first view is completed. So this repeat view test is without clearing the cache.
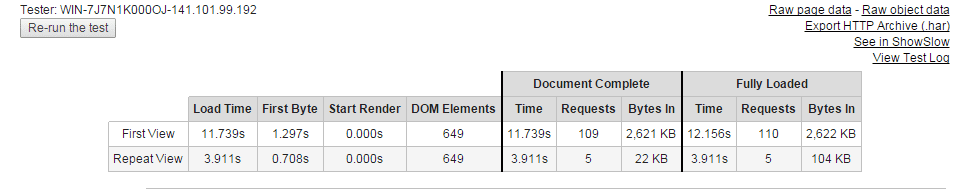
Terms in the Test result Table
Load Time – This time measure is taken from the first navigation of the page to the complete document loading.
First Byte – It is the time taken by the server to build the page for the user. i.e : the time taken from first navigation of page to the time taken by the server for its first bit of response.
Start Render – It is the time taken to let the user know that something is happening in the page (first display of page).
Speed Index – It is the average time at which visible parts of the page are displayed
Document Object Model (DOM) Elements (493) – This is the total measure of elements taken to connect the webpages to scripts.
Document Complete – Happens after all of the images content have loaded but may not include content that is triggered by javascript execution.
Fully Loaded – the metrics collected up until there was 2 seconds of no network activity after Document Complete.
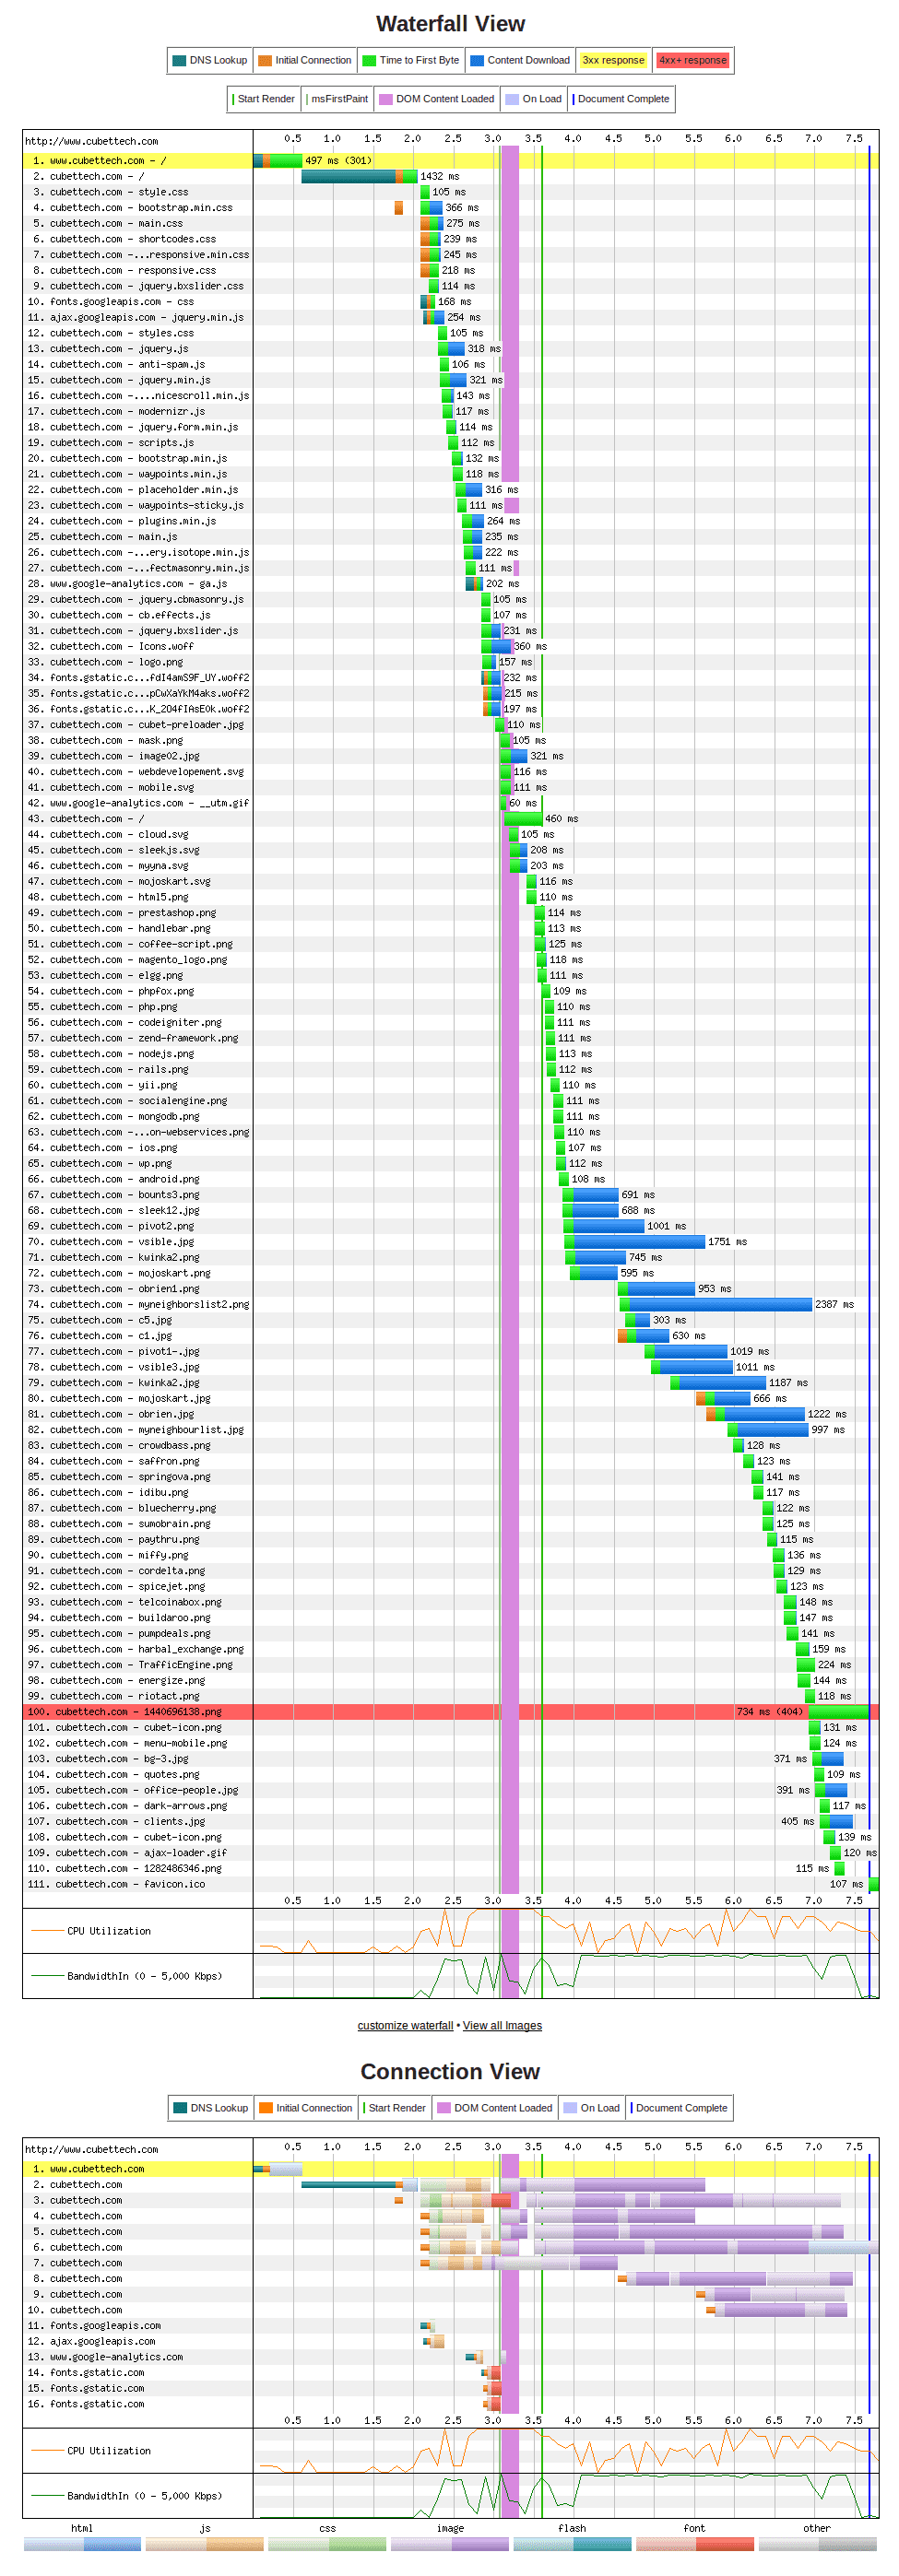
Graphical Representation of First View:
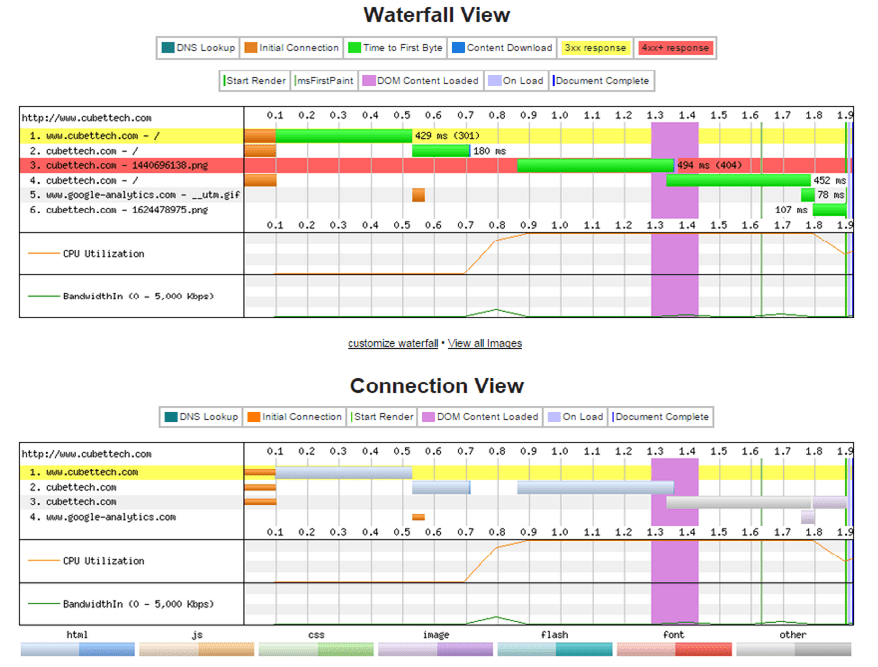
Graphical Representation of Repeat View:
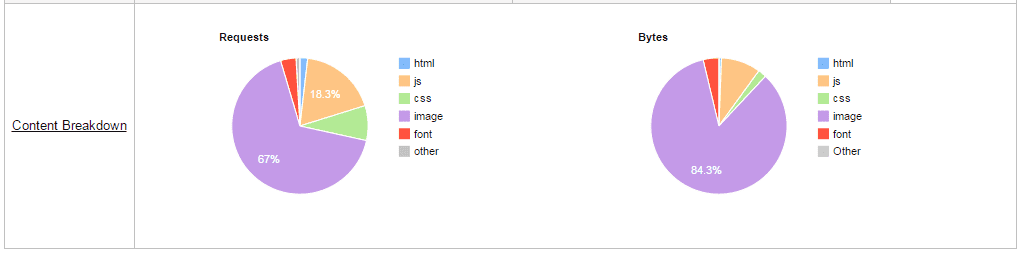
The tool has divided the contents in the test page as per the programming languages and the styles used for its development. The detailed view based on the content breakdown statistics is given below.
This tool is one of the fastest ways to predict the speed of the websites. Results are generated in such a way that even a beginner in performance testing finds it easy to understand.
Trial versions will have only limited no.of virtual users set by default but the no.of users could be increased by purchasing credits.
The only disadvantage of this tool is that the test location cannot be more than one whereas few other open source tools would have this option.
- Share this